Hospitality & FinTech
Automated Tip Management Platform
Tip Sheet
Read case study
Productivity & SaaS
Noorix Works
Timeline
4 mo
Team
3
Launch
Q3 2024
3
Views (Board, Timeline, Calendar)
OKR
Goal Tracking Built In
Live
Real-Time Activity Feed
MVP
Delivered in 4 Months
The existing tools most teams reach for — task boards in one tab, OKRs in a spreadsheet, project timelines in another — require constant context-switching and manual reconciliation. When milestones slip or teams get overloaded, there's no single place that surfaces the picture clearly. Goal-setting ends up disconnected from the day-to-day work.
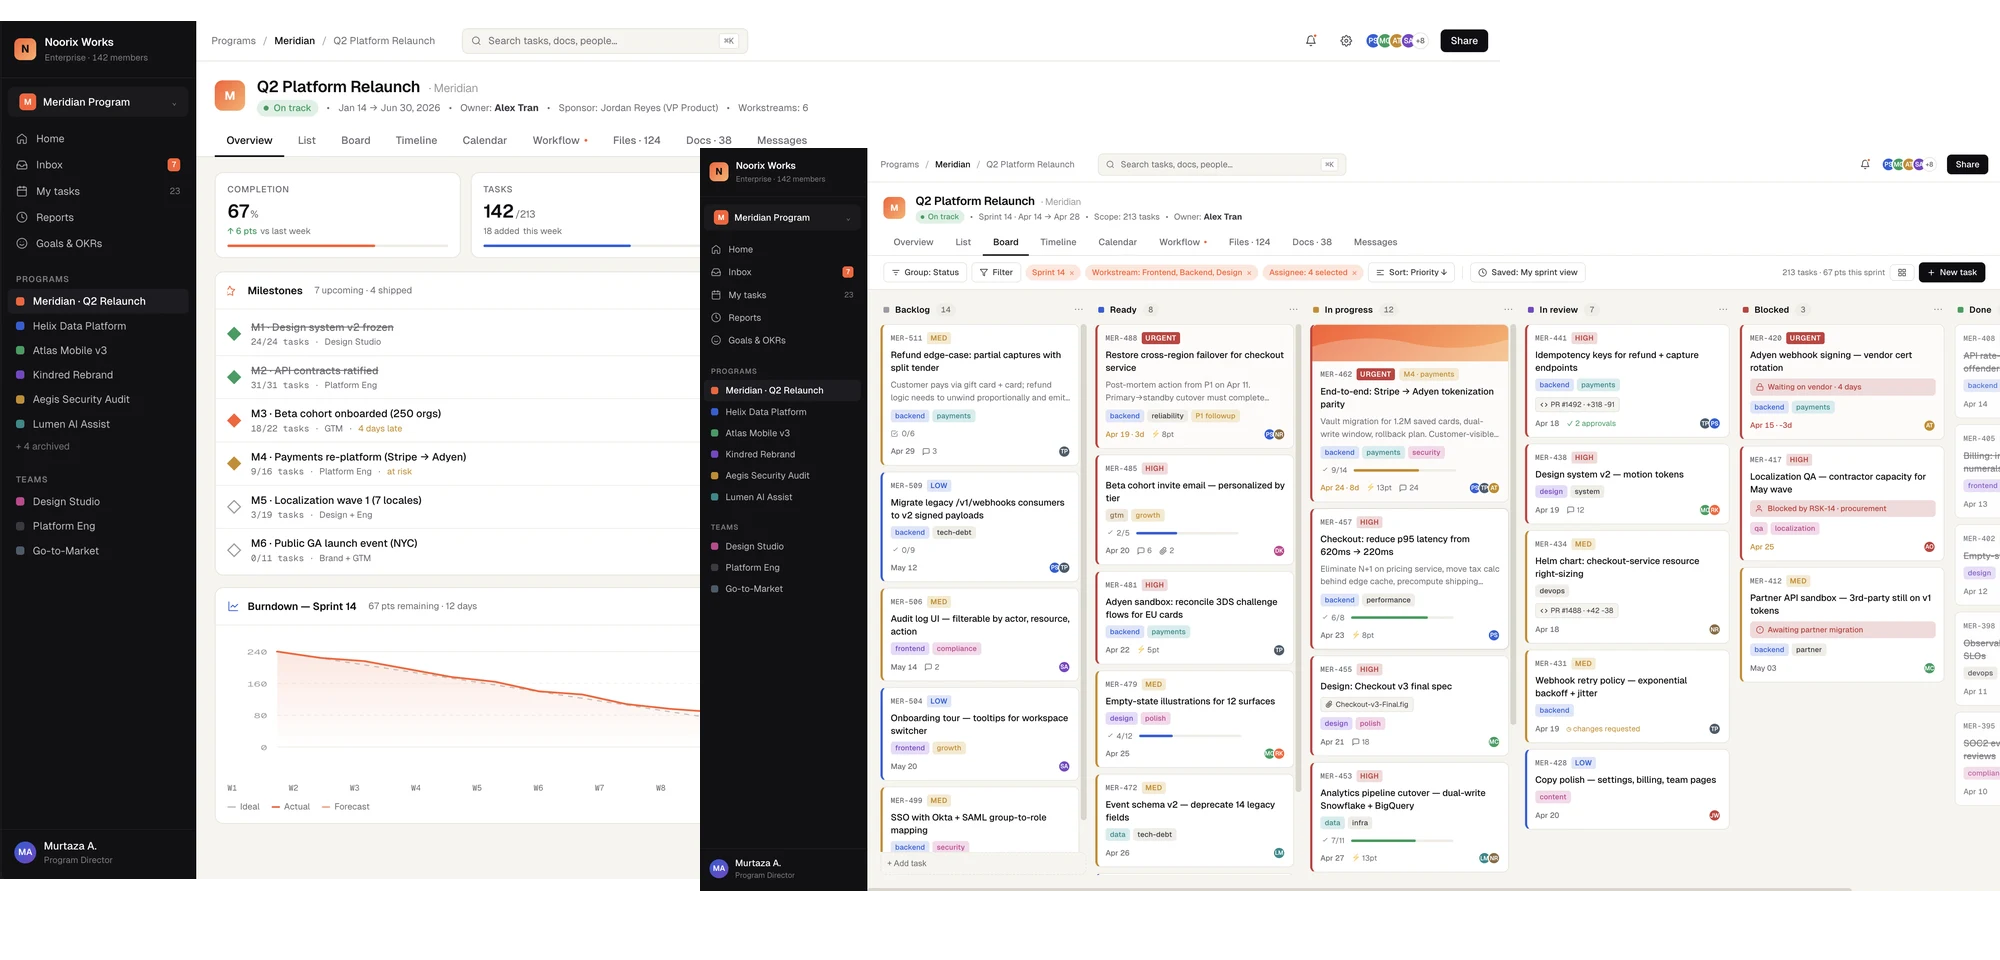
The brief called for a focused MVP that blended Kanban, OKR tracking, and time management into a unified workspace — one where progress on goals was visible alongside the tasks driving them, where team capacity could be monitored without a spreadsheet, and where project health metrics updated in real time as work moved forward.
A web-based productivity platform on Angular and NestJS, backed by PostgreSQL on AWS. The architecture was designed from the start to support real-time updates — WebSockets keep dashboards, boards, and activity feeds live without polling. Redis handles session state and pub/sub routing for concurrent users.
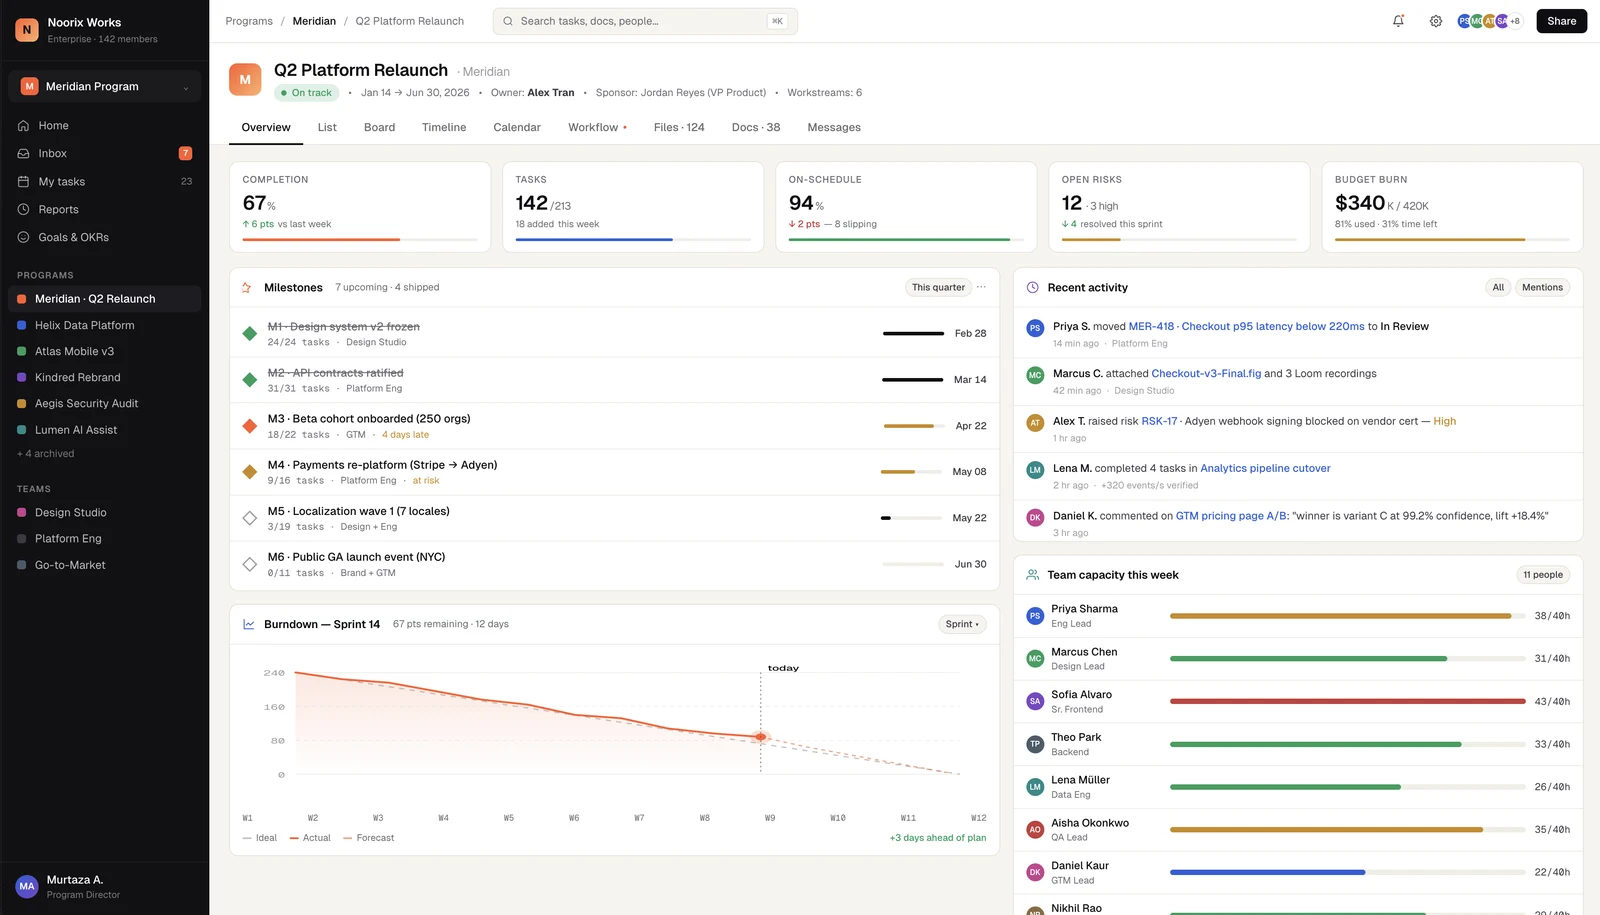
Every project view — dashboard overview, Kanban board, timeline, and calendar — shares the same underlying data model. Milestones, tasks, and OKR goals all link to each other, so progress rolls up automatically. A team capacity chart aggregates open task load per person across the week, giving leads an honest picture of who is stretched before they assign more.
Tech Stack
Live view of completion percentage, task counts, schedule health, and budget burn — alongside a milestone tracker and team capacity chart. Everything relevant on one screen.
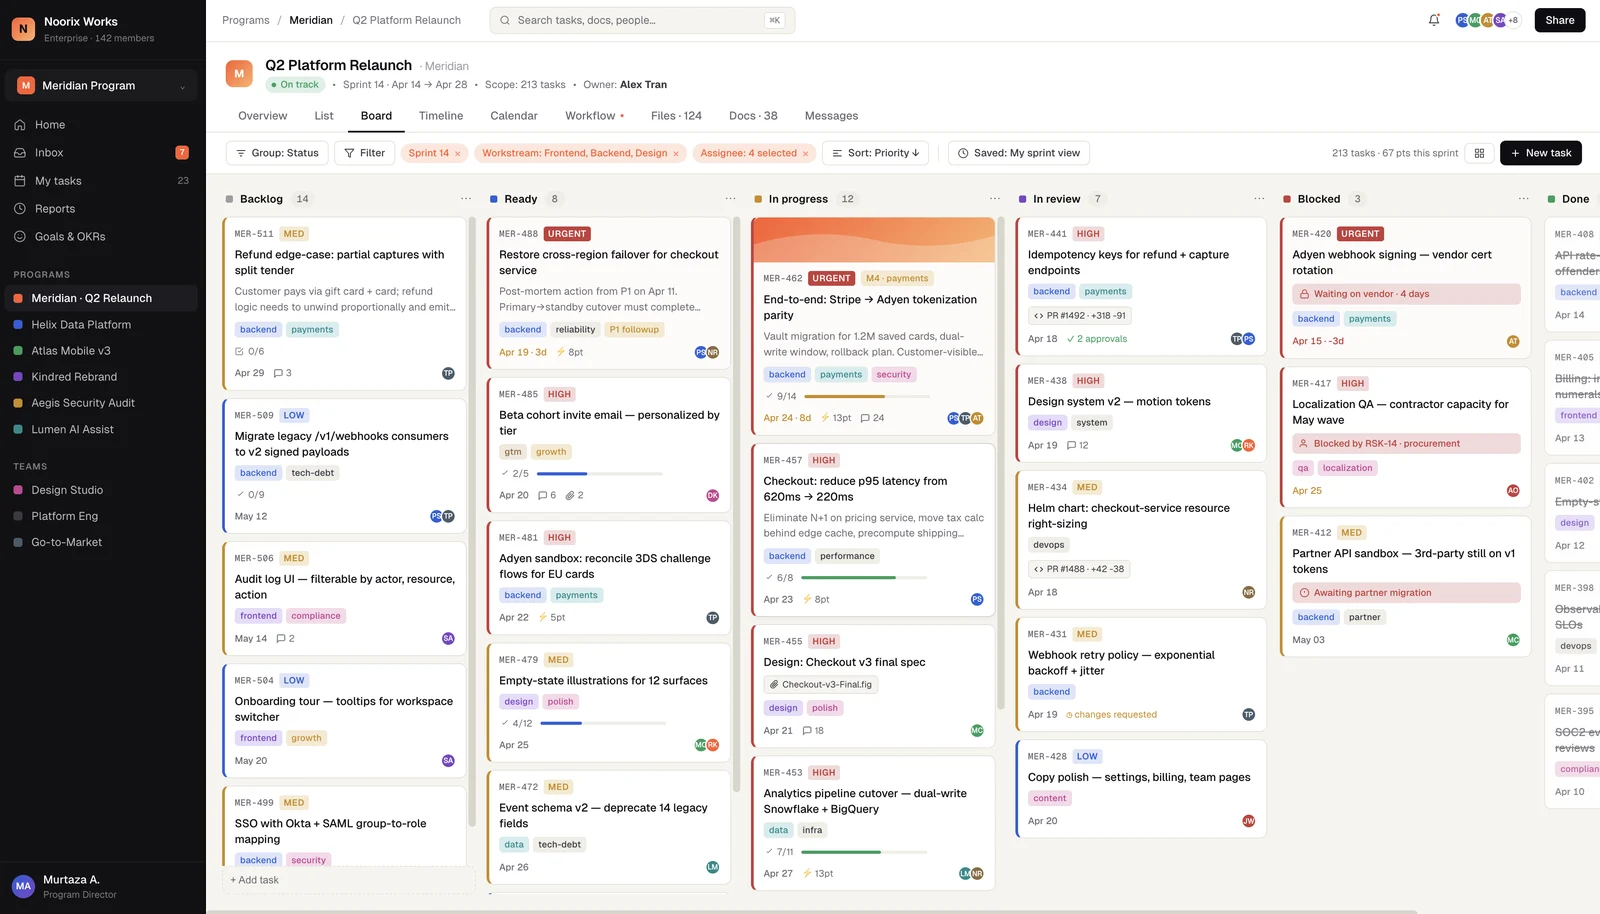
Full-featured board with Backlog, In Progress, In Review, and Done columns. Cards carry priority tags, assignees, due dates, and comments — and move in real time across all connected users.
Goals and OKRs are first-class objects in the sidebar — not a bolt-on. Tasks link to goals so progress updates automatically as work completes. Teams see what they are working toward, not just what is left.
Sprint burndown charts track velocity against scope in real time. Weekly task trends surface whether the team is accelerating or stalling before it becomes a reporting problem.
A per-person capacity chart shows open task load for the current week. Leads can spot overallocation before assigning new work — no manual spreadsheet required.
Board, Timeline, Calendar, and Workflow views all pull from the same data model. Switch between them without losing context — the underlying structure is always consistent.
Approach
The scope was deliberately tight — enough to validate the core workflow, not a complete enterprise suite. Every architectural decision was made with expansion in mind: the data model supports advanced permissions, the auth layer can grow to MFA and social login, and the event-driven backend can accommodate more sophisticated notification and automation rules when the product is ready for them.
Delivered in four months with a three-person team — frontend, backend, and a shared architecture lead — the platform shipped with a complete feature set ready for real user feedback.
Modular architecture
Features are independently deployable modules — new capabilities can be added without touching core project management logic
Real-time by default
WebSockets and Redis pub/sub keep every connected user in sync — no page refreshes, no stale data
Auth-provider ready
Built with Cognito-compatible session management — social auth, MFA, and advanced security policies can be added in a later phase
Metric infrastructure in place
Completion, velocity, schedule adherence, and budget burn are computed server-side on a shared analytics layer — new charts are additive
Free 30-minute consultation — no obligations, just honest advice.